Totals for the week, 5 runs
| Date | Miles | Pace | BPM | WHR% | Cad | Elev+ | Elev- | YPB |
|---|---|---|---|---|---|---|---|---|
| 2012-05-22 | 4.58 | 9:45 | 132.3 | 70.2 | 87.4 | 69.3 | 60.6 | 1.371 |
| 2012-05-23 | 6.02 | 9:20 | 129.2 | 67.7 | 87.3 | 128.1 | 156.1 | 1.463 |
| 2012-05-24 | 4.75 | 9:26 | 125.2 | 64.4 | 88.6 | 58.3 | 86.9 | 1.490 |
| 2012-05-26 | 6.7 | 10:04 | 121.1 | 60.9 | 86.9 | 95.9 | 71.5 | 1.450 |
| 2012-05-27 | 13.54 | 9:48 | 119.6 | 59.7 | 87.3 | 731.5 | 677.0 | 1.524 |
| Summary | 35.59 | 9:43 | 123.8 | 63.2 | 87.4 | 1083.1 | 1052.1 | 1.476 |
Pretty happy with 35+ miles for the week. On the 27th (Sunday) I did a 13+ run and took a hilly route..I need to really focus on hills for the Ragnar Relay. I'm pretty pleased with efficiency of the run...my legs were pretty tired by the end of the week. I learned I'm not used to hills right now though!
One reason they were tired is that on the 26th I did a 'calibration run' where I run to the track at slow pace (2 miles) , and then did 2.5 miles of laps with each lap at 5bpm higher heart rate, then slow jog home (2 miles). This is another way of measuring fitness.
Recently I found an old paper from the early days of HR monitors that talks about using this method to measure your lactate threshold (LT) in a non-invasive way (i.e no blood taken). More on this if I figure out how to do this.
This is a pretty hard run, at the end for the last 400 I was running at 160 bpm and going at about 6:40 pace.
This is a pretty hard run, at the end for the last 400 I was running at 160 bpm and going at about 6:40 pace.
The next graph below shows the HR percentages of each run in the trailing 30 days. You can see the little multicolor band on the 2nd to last run on the right..that's the calibration run stepping through all the BPMs. On the left is the Eugene marathon followed by a bunch of days off.
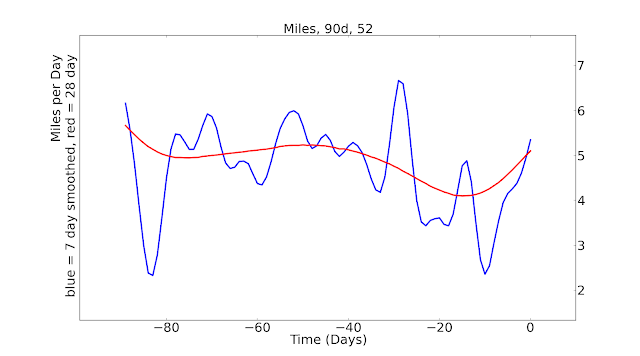
Final graph below is average miles for the trailing 30 days. The 7 day smoothed data shows you I've kicked the miles up a lot this last week. The big dip in the red on the left is from the rest days after the marathon...(look at the gap in the graph above)
So miles are up but hard running is still low..even so this week will be a step back week a bit..and I really need to get back into strength training and drills/myrtle etc!
T
All the green and blue makes it clear I've been taking it easy on the paces and HRs for the most part.
Final graph below is average miles for the trailing 30 days. The 7 day smoothed data shows you I've kicked the miles up a lot this last week. The big dip in the red on the left is from the rest days after the marathon...(look at the gap in the graph above)
So miles are up but hard running is still low..even so this week will be a step back week a bit..and I really need to get back into strength training and drills/myrtle etc!
T


